Ewiser Satellite - AI based weather forecasting

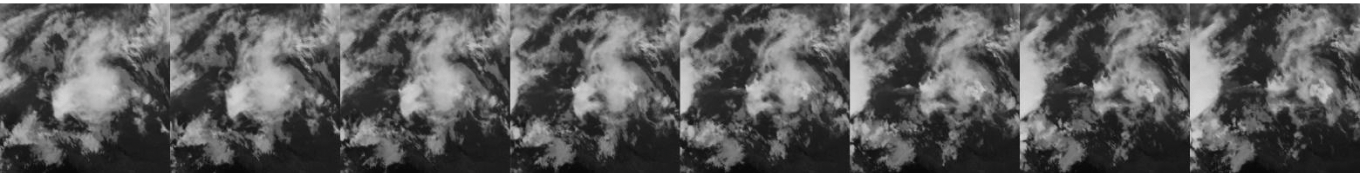
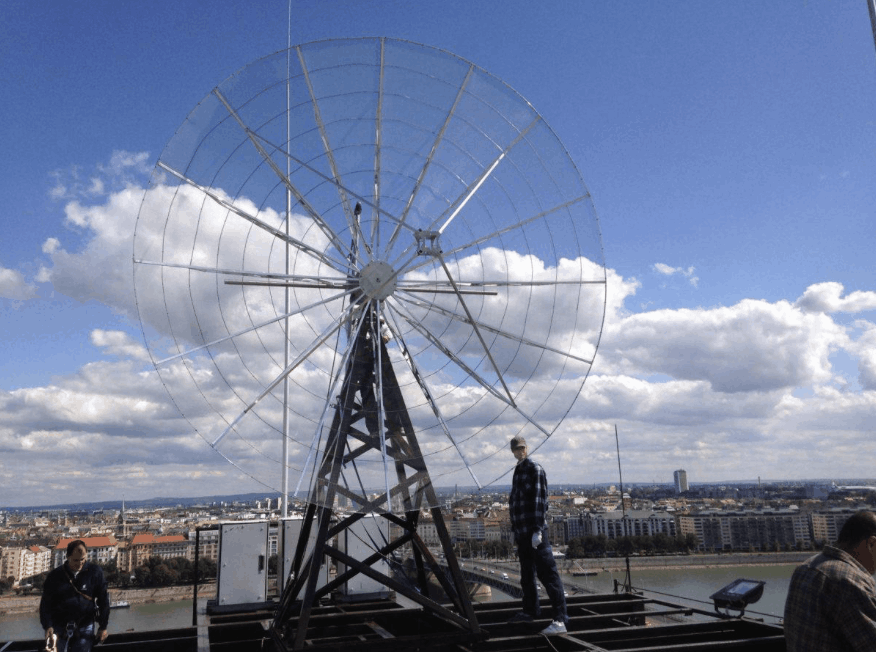
Efficient operation of solar power plants requires accurate and fast weather forecasting, which enables effective management of unexpected weather changes. Our satellite imagery-based, AI-powered forecasting system provides a significant advancement in this area.

How does the system work?

The system uses satellite-based cloud cover images. It operates based on eight satellite images provided by a reliable service provider. These images are captured every 15 minutes, ensuring data is updated in near real-time. Our technology analyzes these images to determine the current state of cloud cover, and with the help of AI, it accurately forecasts the movement and changes in cloud patterns.

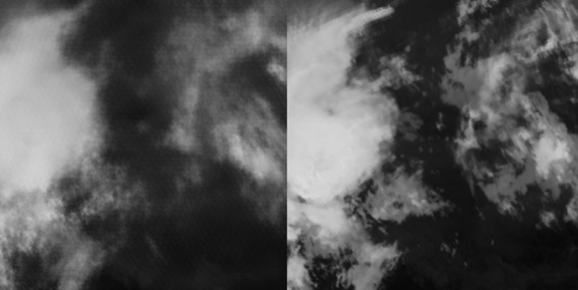
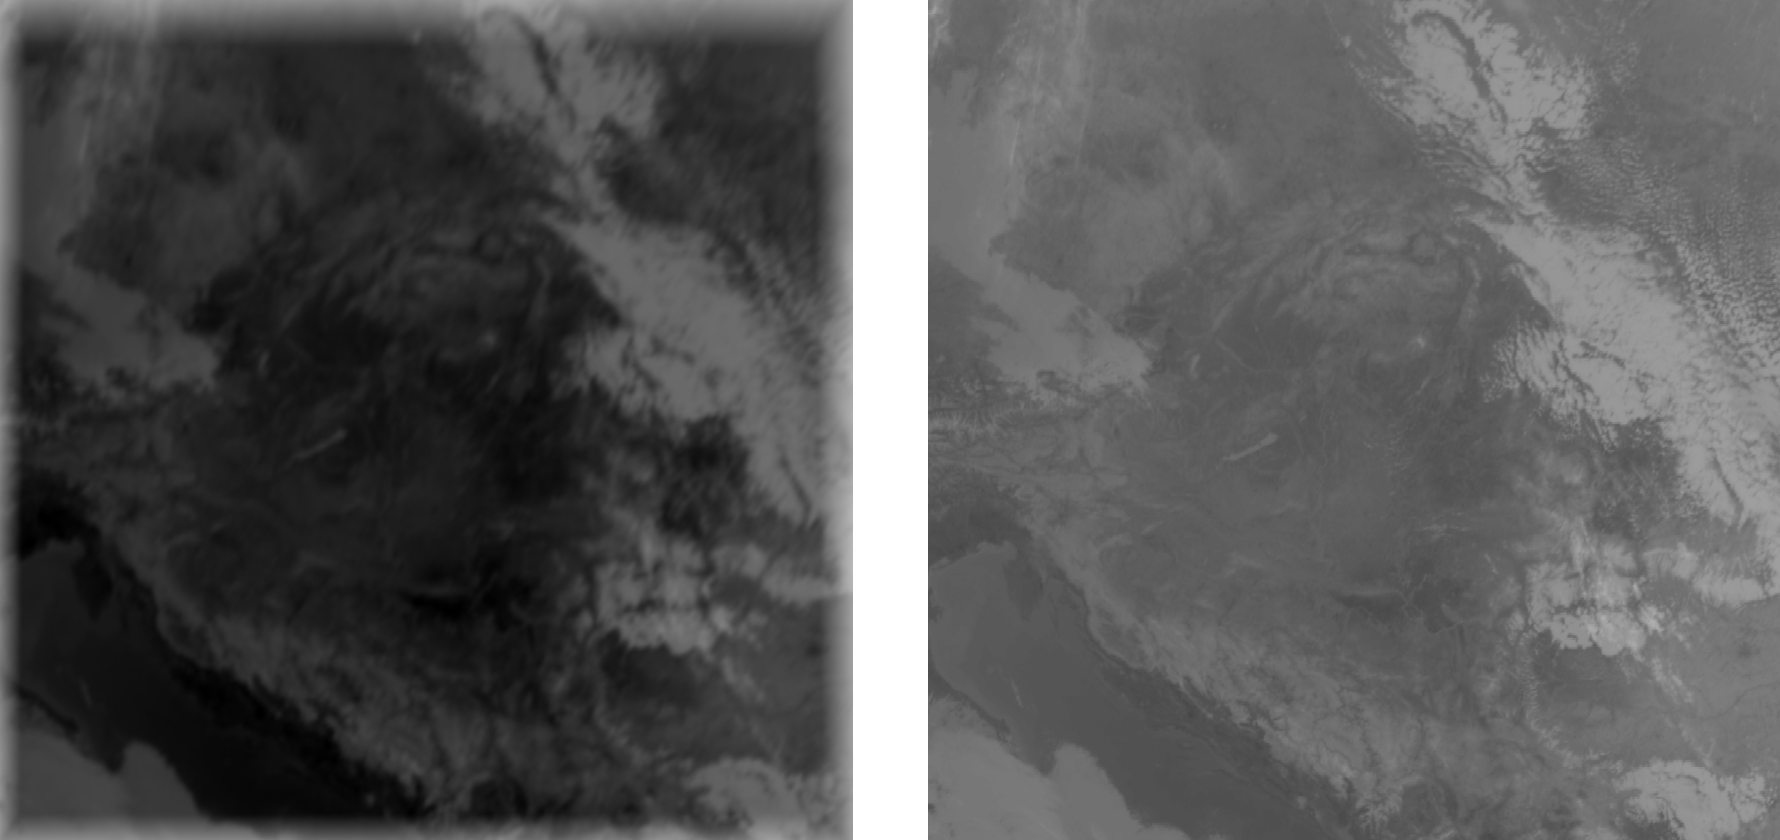
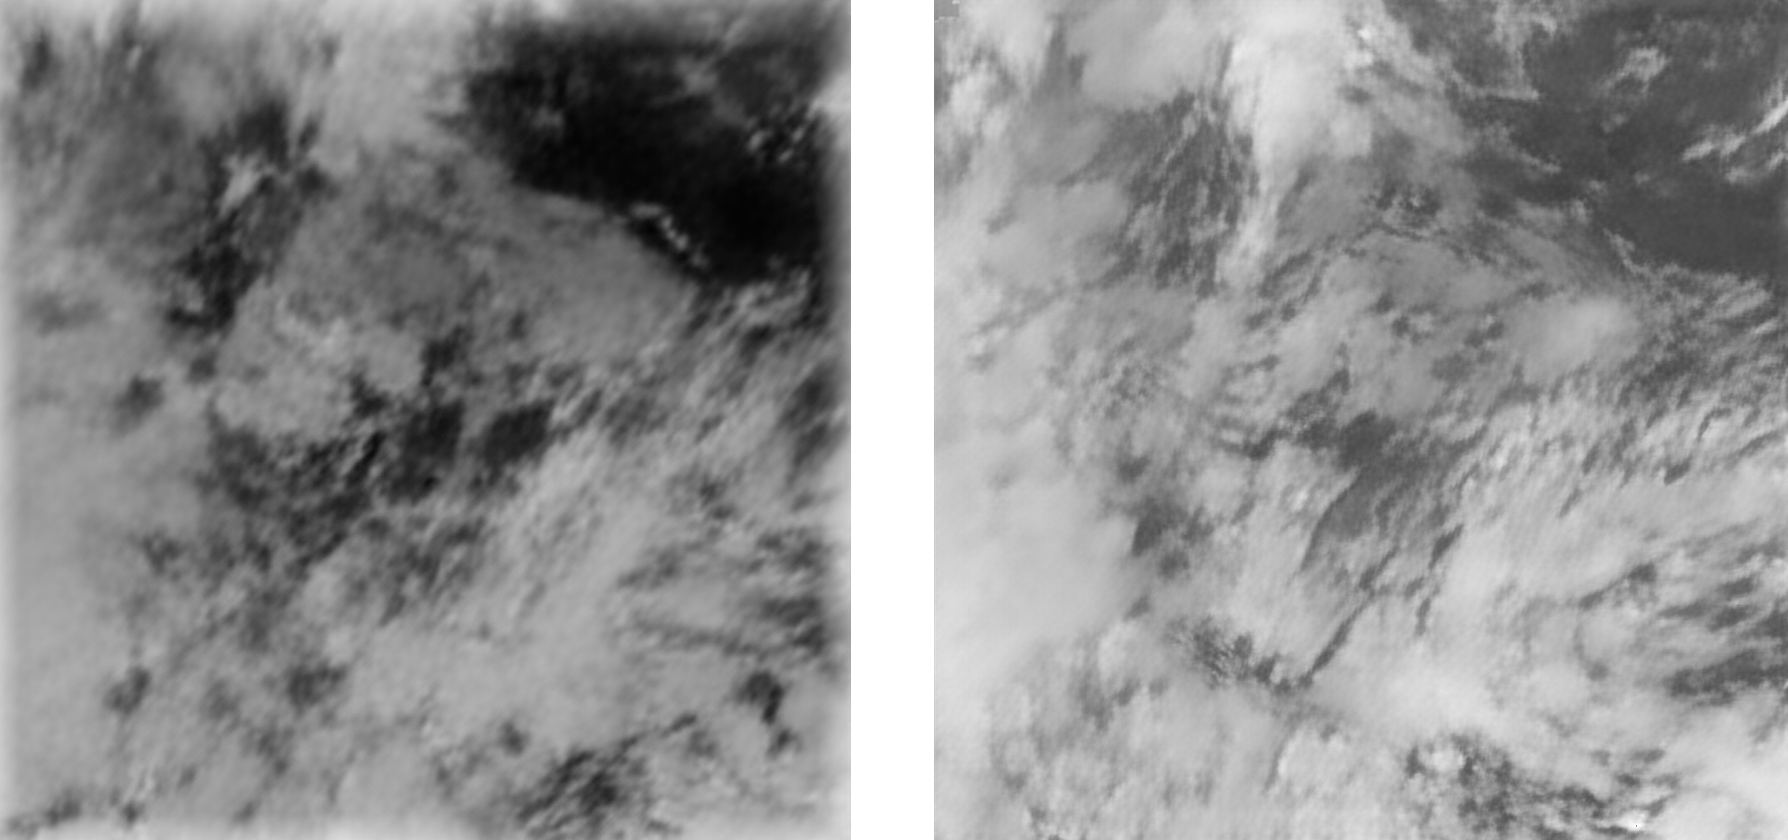
Here you can see the AI model’s prediction compared to the actual cloud movement.

Why is this system important?

Weather conditions can change rapidly, especially when it comes to the movement of cloud fronts, which directly affects solar energy production. General weather forecasting systems are often not fast or accurate enough to effectively detect such sudden changes. Our system stands out in this area, as it is specifically optimized for forecasting rapid weather changes, enabling us to make more precise predictions about energy production.

Benefits for energy production

Accurate cloud cover forecasting allows us to better optimize the operation of our solar power plants. This means that if a sudden increase in cloudiness is expected to reduce production, we can respond in time and minimize potential losses. Additionally, more precise forecasts help reduce the costs associated with maintaining reserve capacities, as there is less need to prepare for unexpected events.

Comparison of satellite models

The original images used to train the new model have a resolution of 1024x1024, compared to the previous 512x512. They were taken from the IR105 layer instead of IR108, as this was the only layer available in such high resolution from the provider. I’m also working on a new model, but at this stage, only a prototype version has been trained.

Metrics
    The images were compared using the following methods:
  • PSNR: Measures the ratio of useful data to noise. The higher, the better — typically ranges between 16–30.
  • MSE: Calculates the average squared difference between corresponding pixels. The lower, the better. However, it’s less comparable across different resolutions.
  • SSIM: Indicates how visually similar two images are. Values range between 0 and 1, where 1 is a perfect match.
  • LPIPS: Also measures similarity, but by dividing images into smaller patches and comparing those. The lower, the better, with a range of 0 to 1.
  • FID: Unlike the others, this doesn’t compare images one-by-one but evaluates the whole set of images as a distribution. Lower scores indicate better similarity to the reference set — 0 means perfect match
Results of the old model over 3 weeks

Week start Week end PSNR MSE SSIM LPIPS FID
2025-02-17 2025-02-2424.9646245.9158130.82440.125258.44
2025-02-242025-03-0322.0934439.9075060.66850.201167.77
2025-03-032025-03-1025.2581284.3960000.78430.135164.35
2025-03-102025-03-1618.15841029.8549170.53990.277497.68
Results of the new model over 3 weeks
Week start Week end PSNR MSE SSIM LPIPS FID
2025-02-17 2025-02-2429.899772.8745300.88220.122948.09
2025-02-242025-03-0325.9315176.9182940.77570.189454.20
2025-03-032025-03-1028.1371360.6699980.83770.138657.85
2025-03-102025-03-1619.43341419.6786900.61550.299472.88

Image comparison

In the comparison, the old images are on the left side, and the new ones are on the right.

2025.02.20 13:00 original
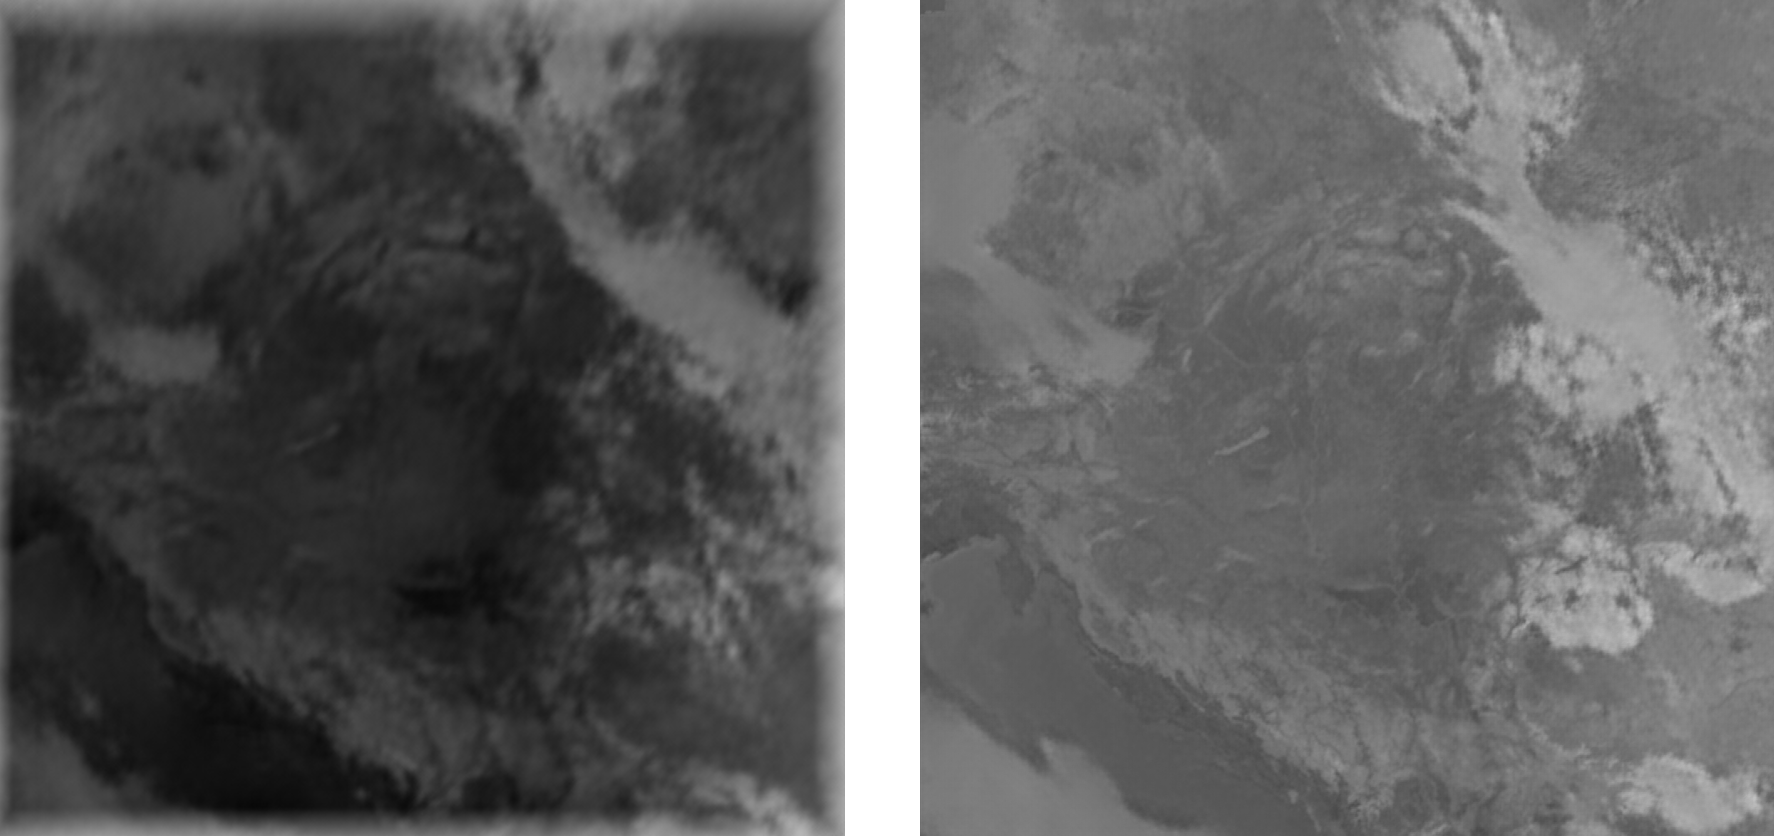
Predicted

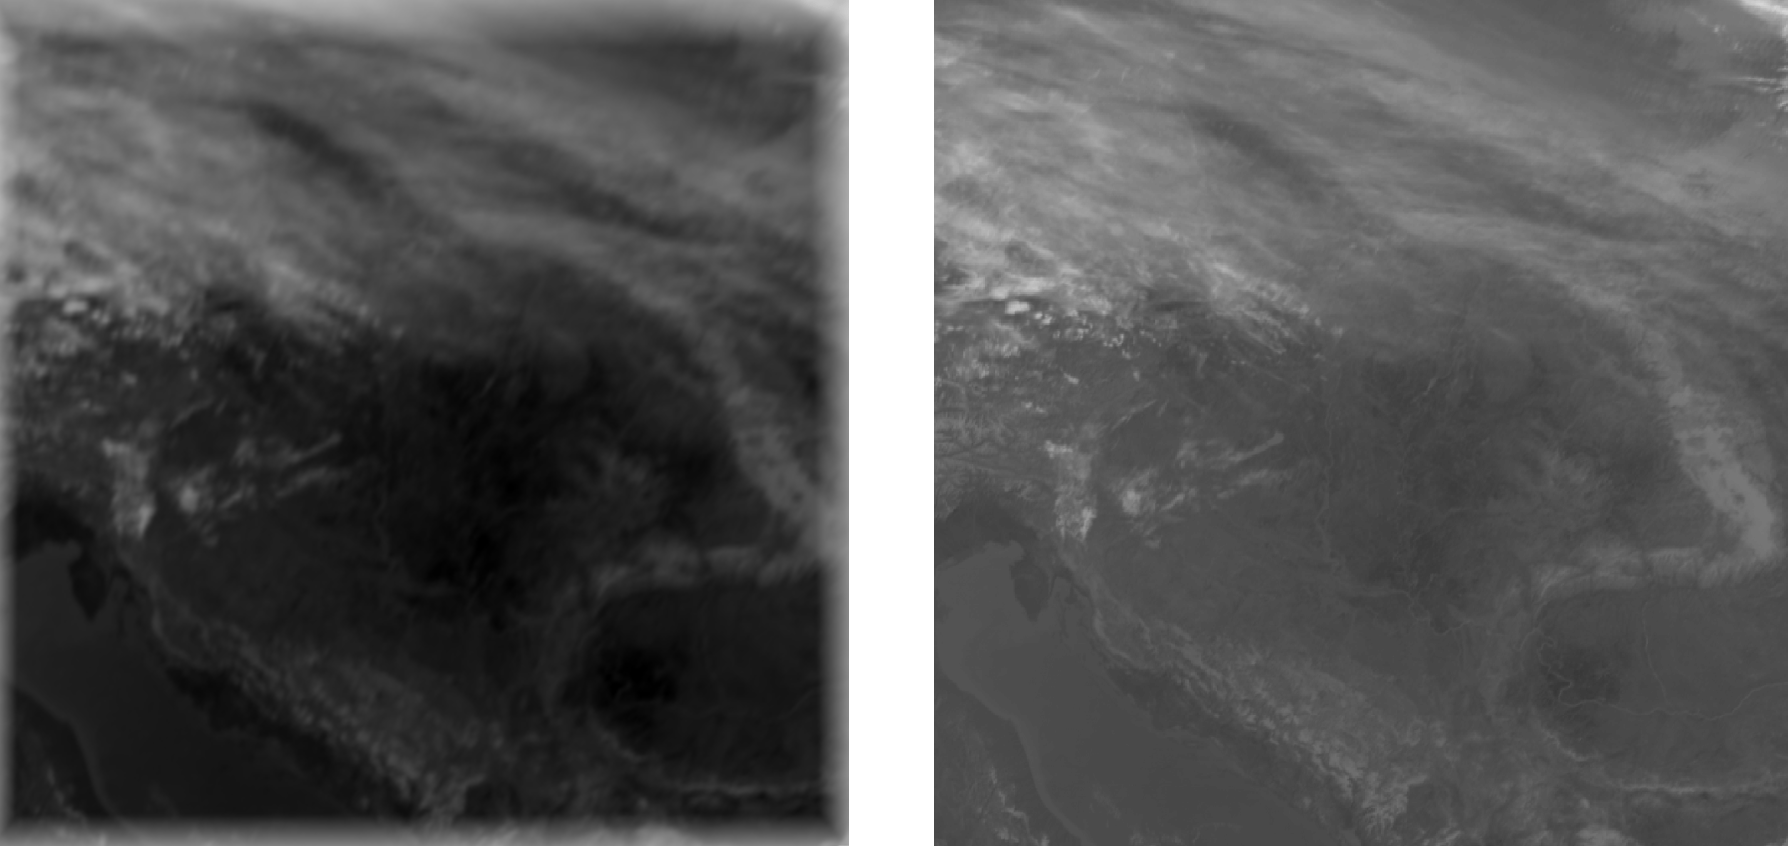
2025.03.04 09:00 original
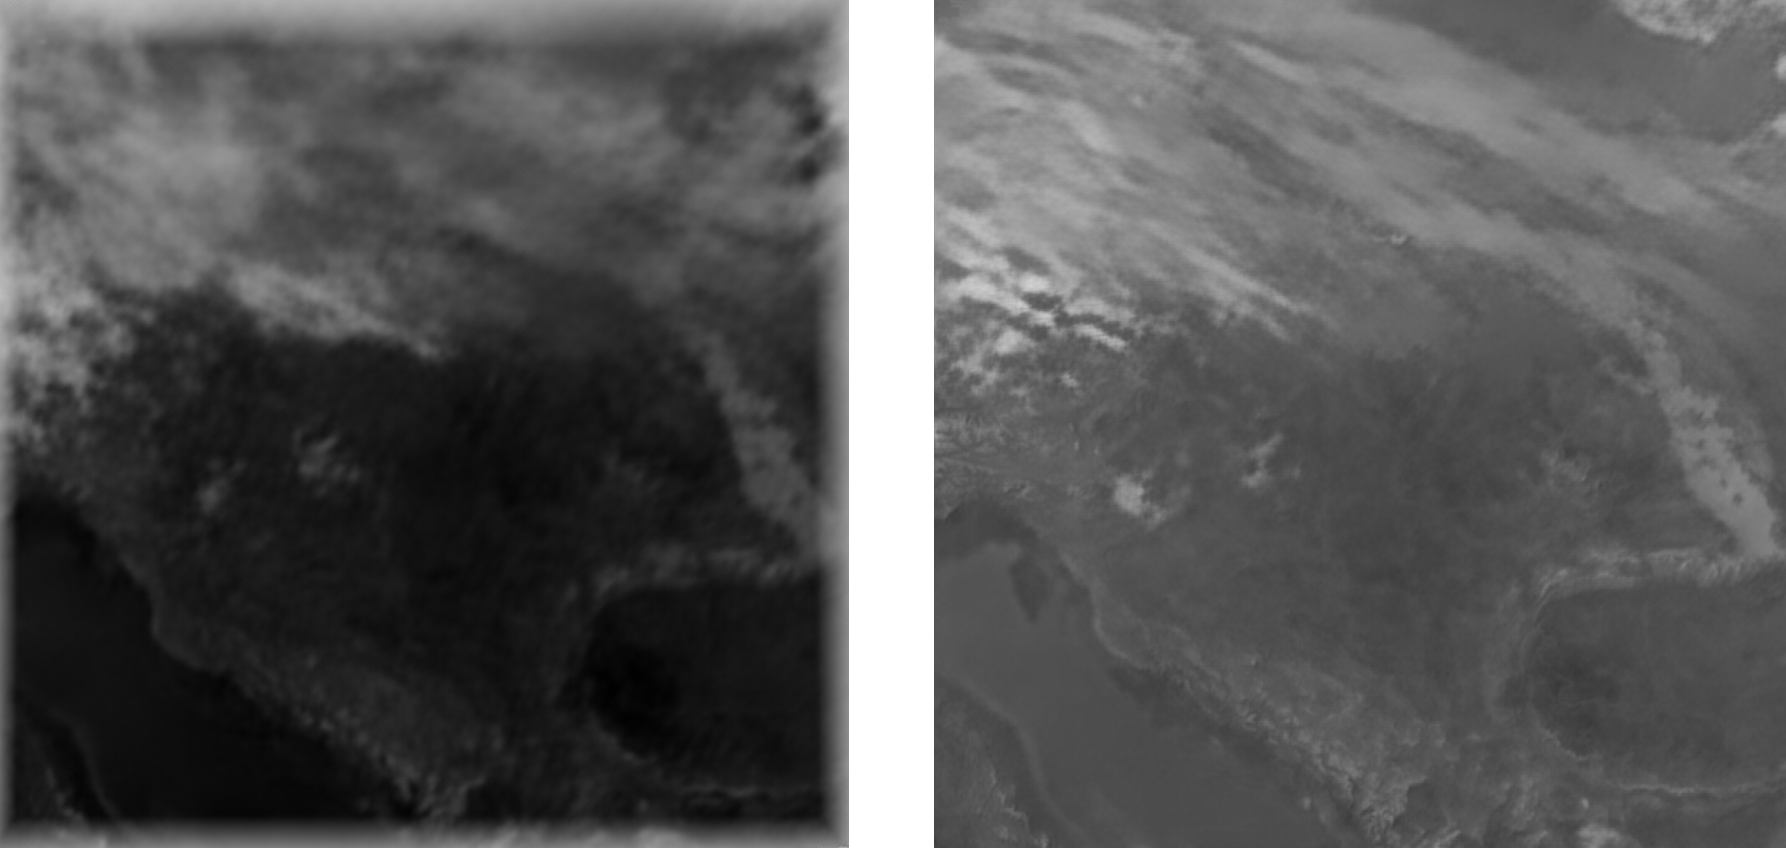
Predicted

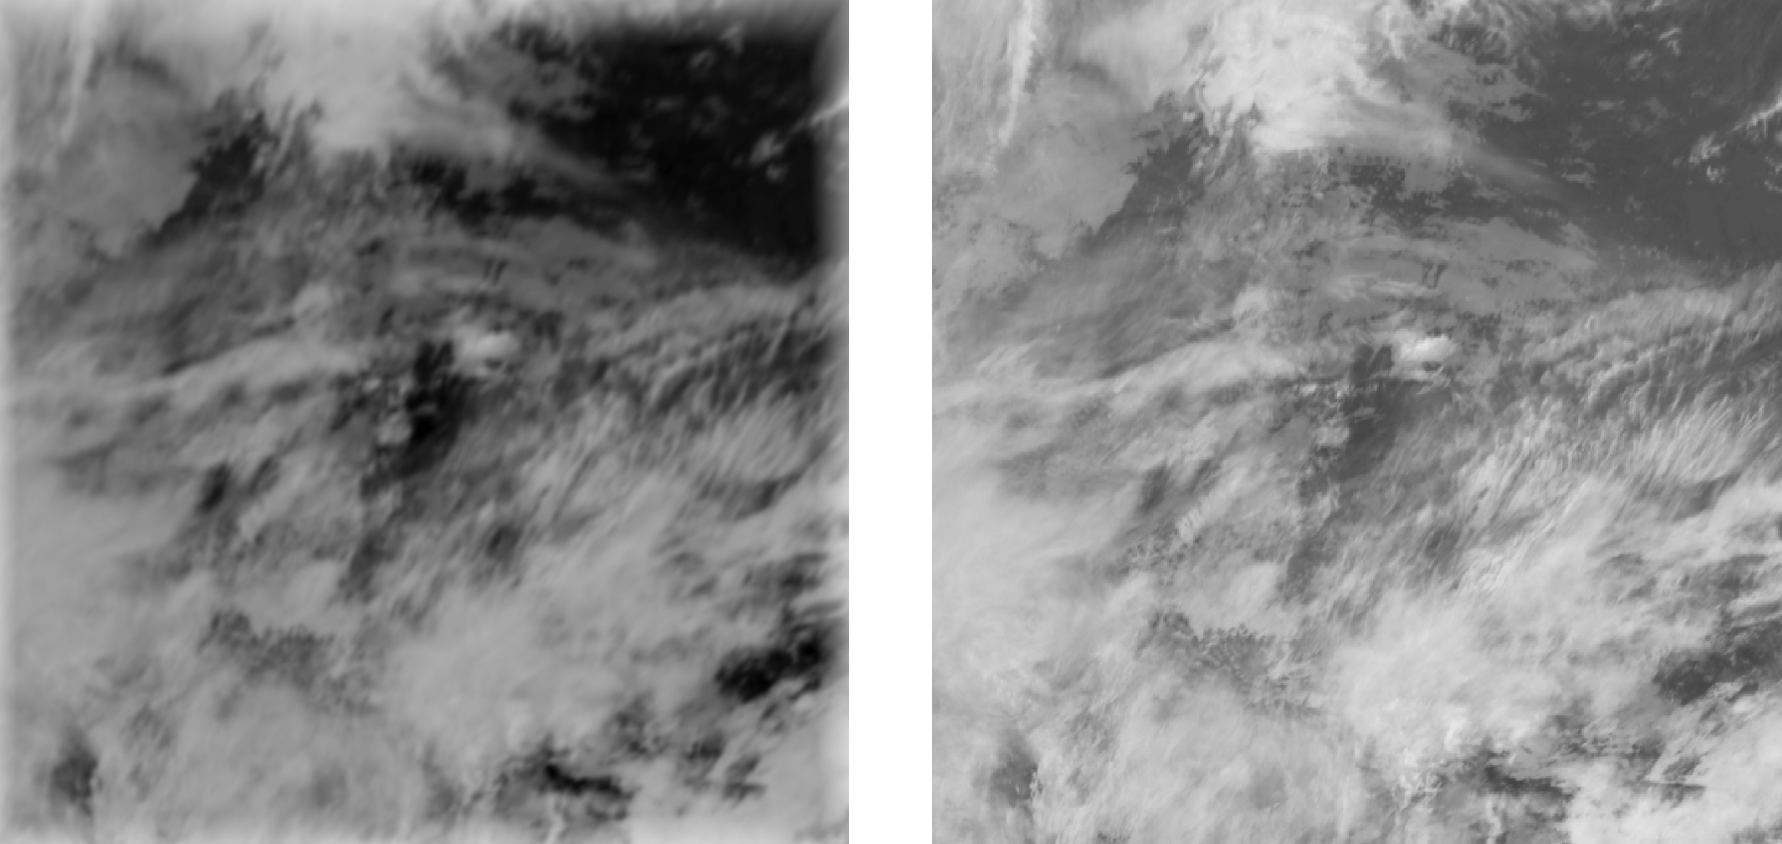
2025.03.12 16:00 original

Predicted

EWISER APPLICATION 

USE OUR APPLICATION 

Get it on
Google Play
Download on
the APP Store

Ewiser Forecast

Contact

Meeting room: Budapest, Margit Palace, Henger utca 2/c, 2. emelet

Get a quote!